Management dashboard on a screen
Ebix Meridian

Reporting and compliance across lines, clients, and regions.

Portfolio and operational reporting, a report builder, Excel and PDF export, compliance support across jurisdictions, and an audit trail across the entire system, drawn from the same records and accounting engine the brokerage works in.

the module, end to end

The reports a brokerage runs on

Because every module writes to the same record and the same ledger, the reports are drawn from one data model rather than reconciled from several.

01

Portfolio and operational reporting

Visibility across lines, clients, and regions, for management oversight of the whole book.

02

Report builder

Customised reports created according to user needs, with full control over content and layout.

03

Export and electronic submission

Reports to Excel and PDF, and electronic submission directly from the application.

04

Compliance support across jurisdictions

Reporting that supports regulatory requirements in each country the brokerage operates in, with smooth audits.

05

Audit trail across the entire system

Every action on every record, kept as the evidence regulators and insurers ask for.

06

Renewals due

Renewals by month, producer, insurer, and class, with status, so the pipeline for the next quarter is visible today.

07

Income

Commission and fee income by insurer, class, product, producer, and period, from the ledger rather than a re-keyed summary.

08

Receivables and ageing

Outstanding client balances by age and producer, and unallocated cash, for the collections conversation.

09

Insurer settlements

Premiums due to each insurer by period, settled and outstanding, matching the settlement runs.

10

Claims

Open and closed claims by insurer, class, client, and handler, with reserves and payments.

11

Producer and team activity

New business, renewals retained and lost, and open tasks by producer and team.

12

Client and book analysis

The book by class, insurer, premium band, and renewal month, for planning and for insurer conversations.

13

Exports

Every report to PDF and spreadsheet, and the data behind it available for the tools the brokerage already uses.

Reporting for every seat

The same data, presented for the person reading it.

01

Principals

Income, retention, receivables, and the renewal pipeline on one dashboard.

02

Team leads

Queues, backlog, and activity by person, before the month-end conversation.

03

Accounts

Receivables, settlements, and reconciliations from the same ledger the reports read.

04

Insurers

Book and bordereaux reporting for the insurers and binders the brokerage works with.

Inside the module

The dashboard and the analysis views as principals and team leads use them.

The brokerage dashboard

Income, retention, receivables, and the renewal pipeline on one screen, updated from the live ledger and diary.

  • Income and retention this period
  • Receivables ageing
  • Renewals due next quarter
ebixevolution.com/dashboard
Brokerage dashboard

Analysis by any cut

The book by class, insurer, producer, and renewal month, filtered and exported for the conversation at hand.

  • Book by class and insurer
  • Producer activity
  • Export to PDF and spreadsheet
ebixevolution.com/reports
Analysis views

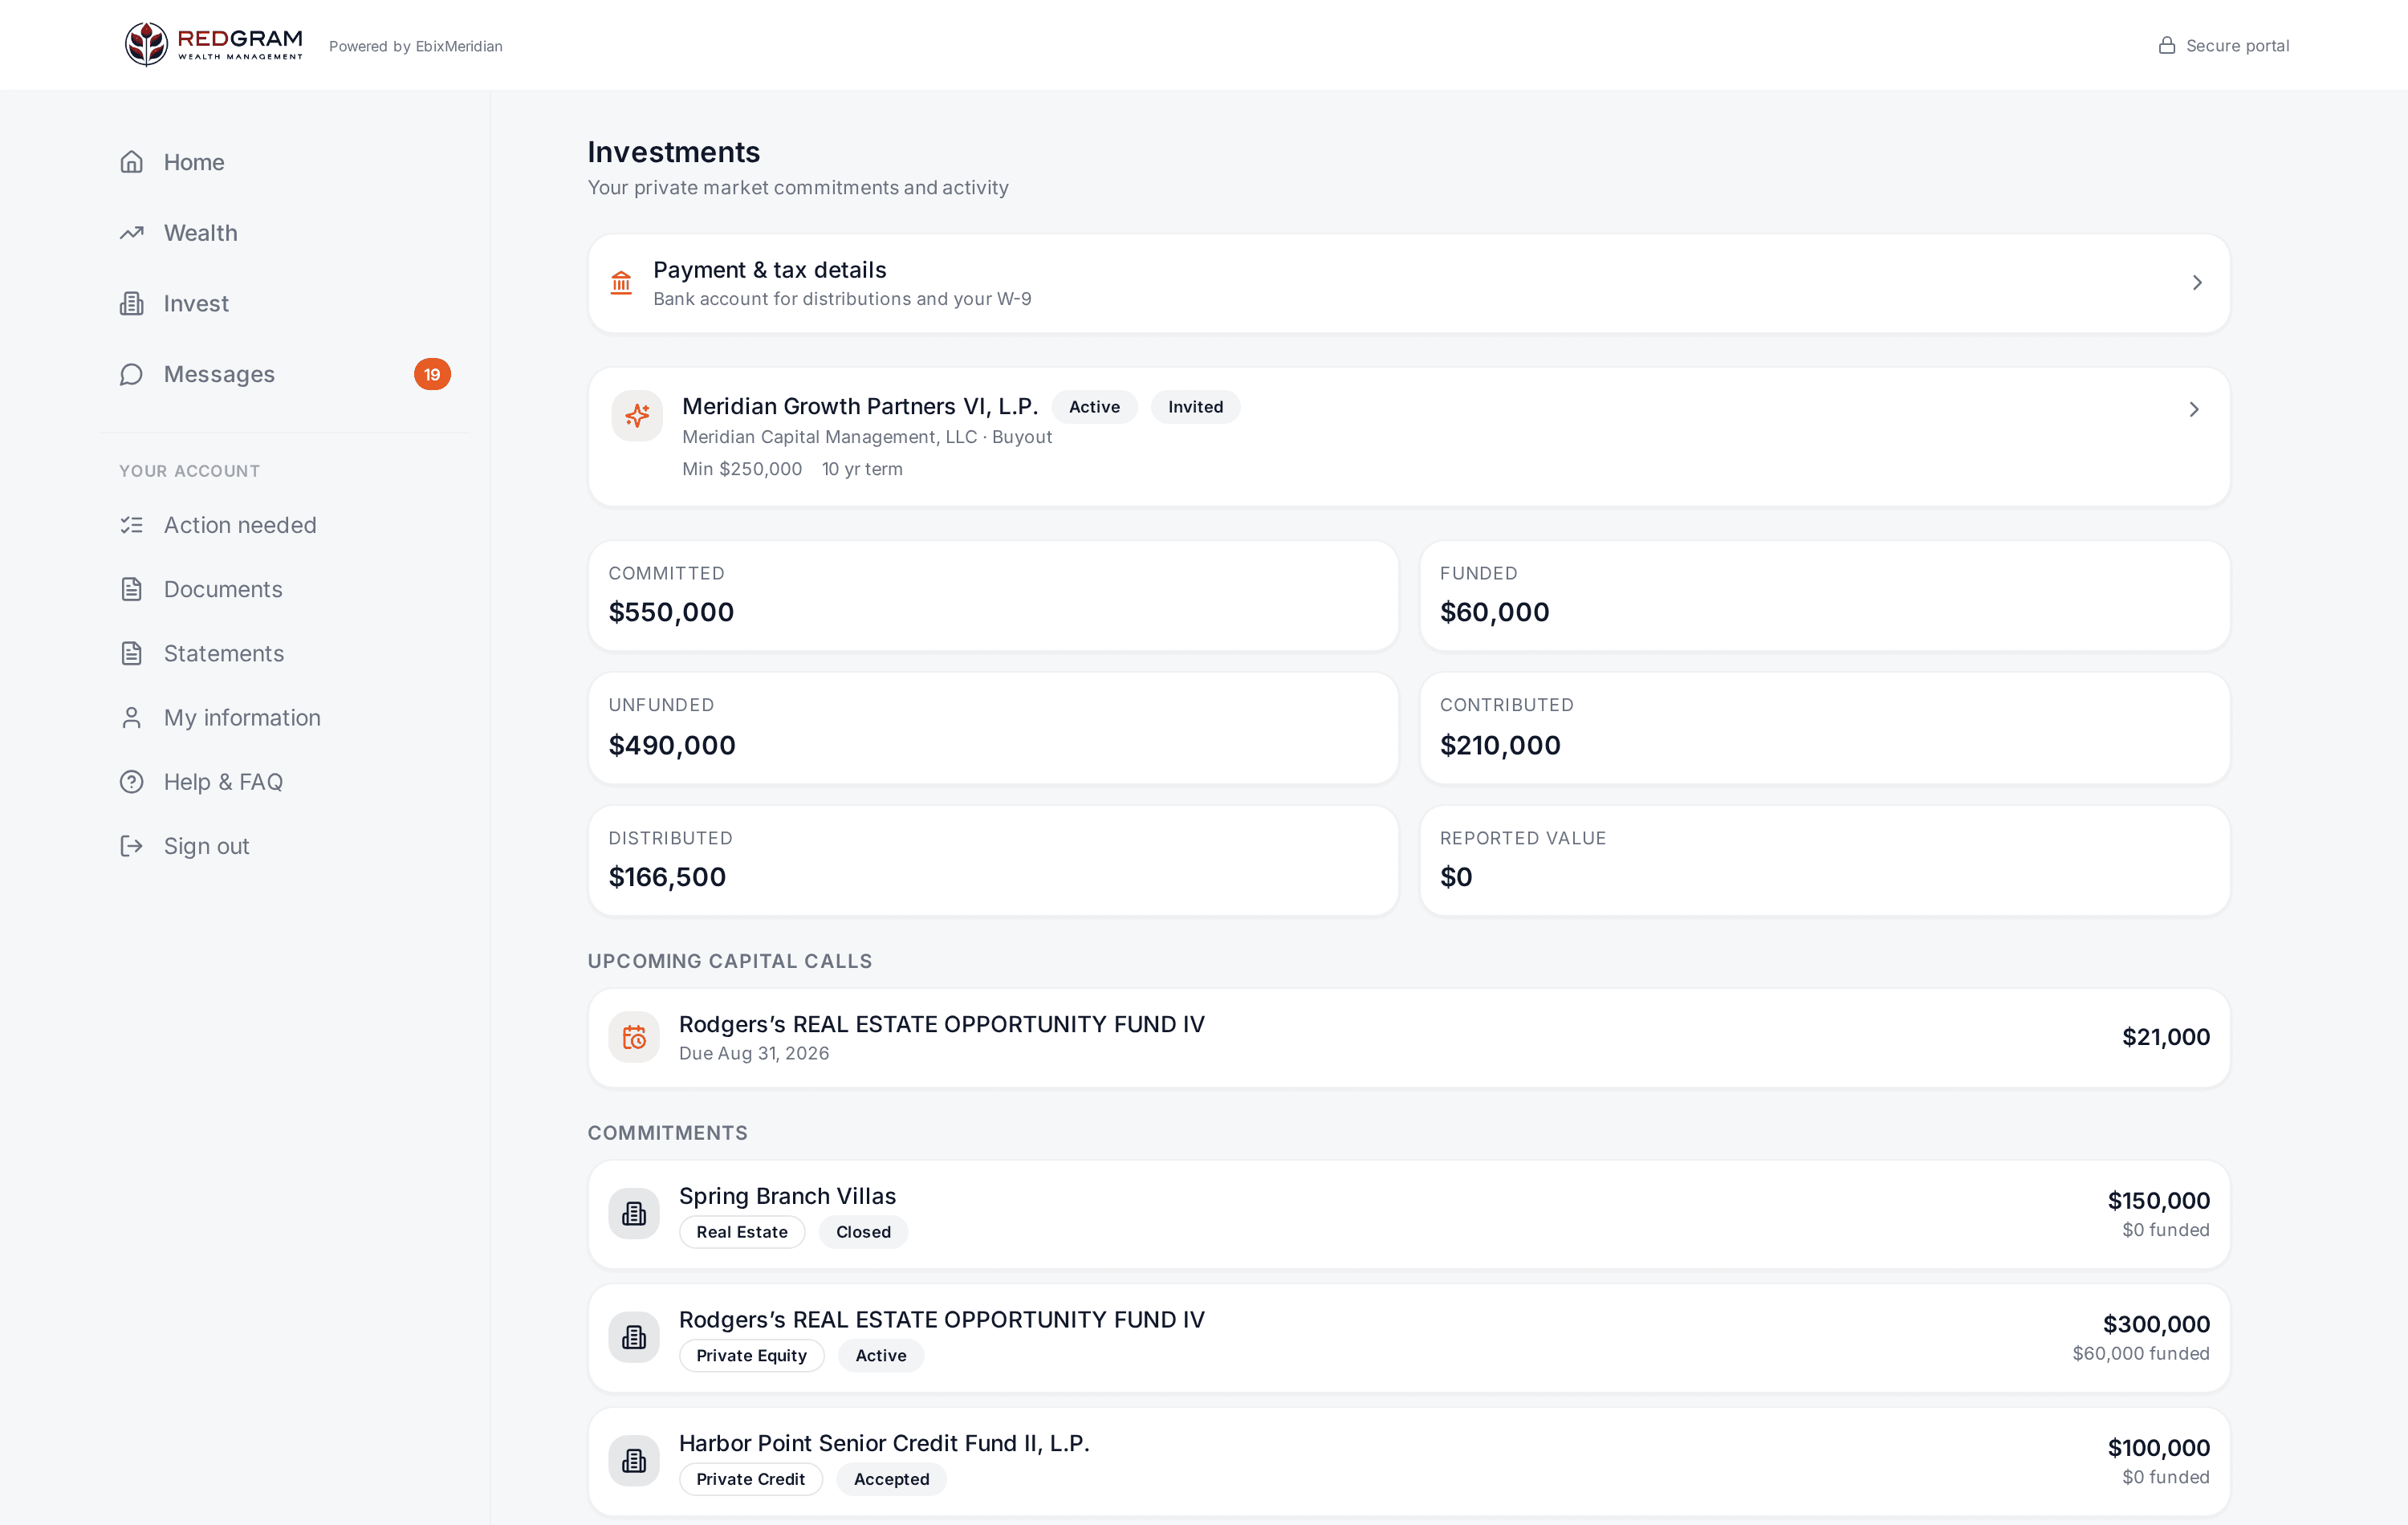
Actual product screens, shown as configured and white-labeled for RedGram Wealth Management, an investment advisory firm running on Ebix Meridian. Your firm gets the same portal under your own brand.

Illustrative screens · EbixEvolution captures to follow

Why the numbers agree with each other

When reports come from several systems, the first hour of every management meeting is spent reconciling them. On EbixEvolution the income report, the receivables report, and the settlement report read the same ledger.

One ledger behind every figure

Income, receivables, and settlements agree by construction.

One diary behind the pipeline

Renewals due are the diary, not an export of it.

One client file behind the book

Book analysis reads the same records the brokers work in.

Exports for everything else

The data is yours to take into the tools you already use.

See your book
on the dashboard

Bring a recent management pack and see the same figures come off the platform.